- Home
- About Us
- Services
- Subdivision
- Land Surveying
- Farm Mapping
- Computer Drafting
- Civil Engineering
- Resource Consent Application
- Aerial survey and mapping
- 3D Laser Scanning

A landslide on Clifton Beach earlier this year injured two Korean tourists when they were washed out to sea. Following this event the beach was closed while Hastings District Council undertook a Risk Assessment.
The Surveying Company was contracted by Stantec on behalf of Hastings District Council to provide data collected by UAV to assist the Council in making public safety decisions regarding access to the Cape.
Initially we concentrated on assessing the main rockfall where the tourists were injured, then proceeded with mapping the whole coastline from the Clifton Motor Camp to the Gannet Colony at the tip of the Cape to inform a Quantitative Risk Assessment being undertaken by the Council and the Department of Conservation. The reason for mapping the entire beach was to have a highly accurate 3D model to use as a baseline for future monitoring and rockfall event analysis. This data was necessary in order to determine whether the beach would be safe to access again.
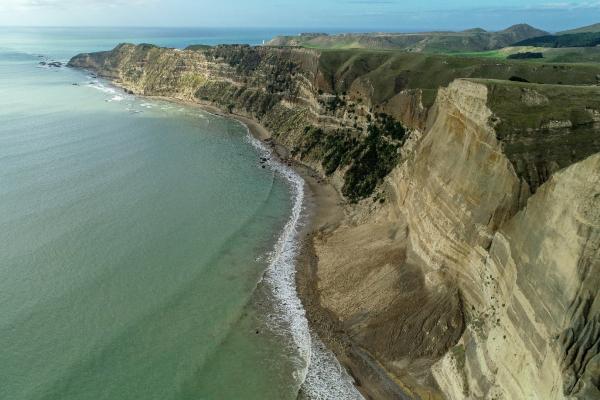
The main rockfall at Clifton Beach
To map the cliff faces we used a combination of RTK GPS and a PPK GPS unit mounted to our UAV.
We connect each UAV survey to the existing survey network by locating and measuring survey marks in the local area. Our GPS base station is then set to log raw GPS data for the duration of each UAV flight.
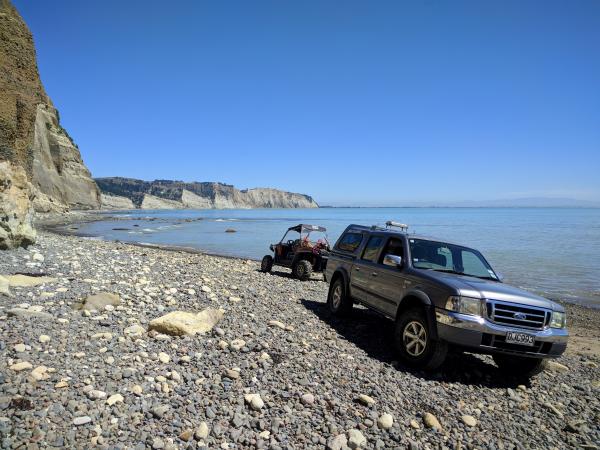
On the beach at low tide
Access to the beach needed to be pre-planned as the beach is only accessible via 4WD during low tide, giving us a window of about three hours. Neap tides severely shortened the amount of time we could spend on the beach, and there were a few hairy moments when returning from the job on one occasion! The position of the sun also had to be right to provide good quality photography.
Before each flight, check points and control points are marked on the beach and measured with RTK GPS. These help verify our data once it has been processed. The marks were temporary (non-toxic spray paint) and disappeared with the next high tide. We couldn’t leave permanent marks on the beach.
Having a high accuracy on-board PPK GPS system was a must as there was no access to the cliffs above the beach, and line of sight to the base station was not possible, eliminating the use of RTK GPS on the UAV.
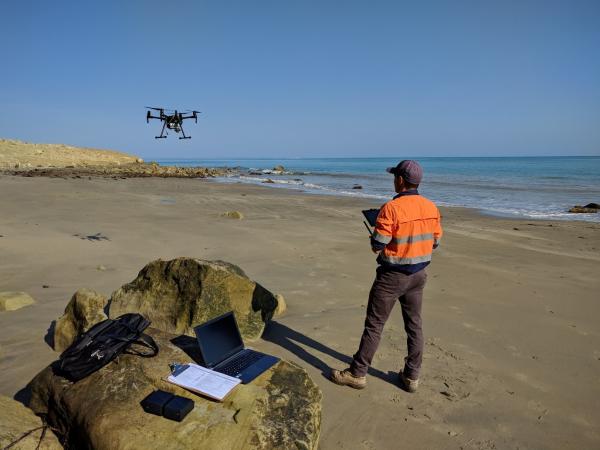
The Matrice 200 coming in for a battery change
The beach was split into 1km sectors in order to make the mapping process easier. Each sector had a series of flights manually designed in the office that conformed to the natural topography. Relatively constant offset from the ground and cliff faces was maintained to provide high resolution imagery over the entire project.
While the UAV was in the air it recorded images at regular intervals while ensuring a high overlap of imagery to give a complete dataset at the end.
The UAV flew each planned flight flawlessly and despite the cliffs shading half the satellites, especially at low flying altitudes, the PPK GPS system gave a fixed solution for each photo location.
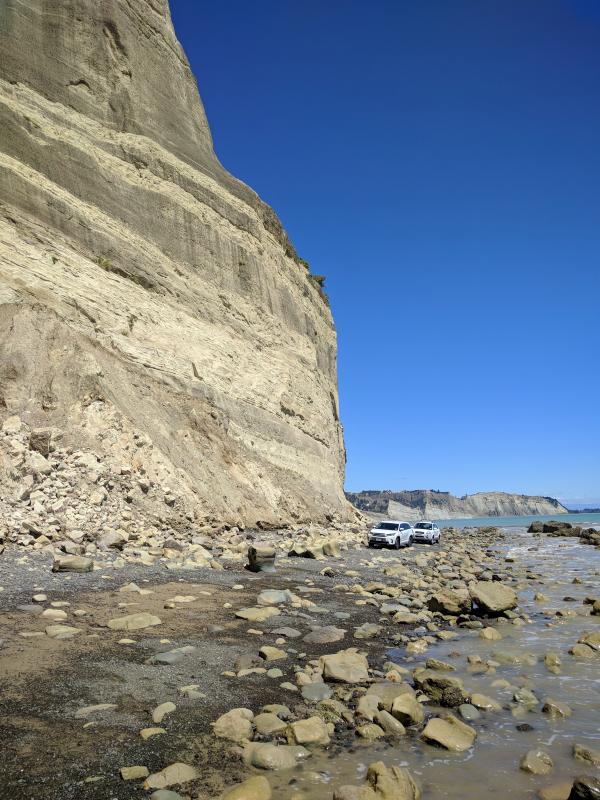
Cliffs up to 140m tall posed potential multipath and satellite shading issues – especially at low altitudes
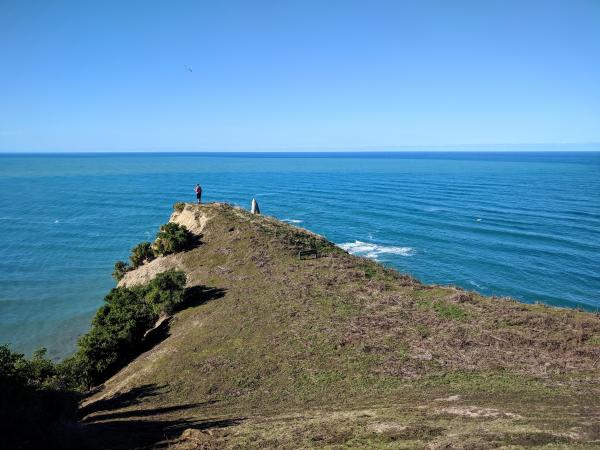
Flying with the gannets at Cape Kidnappers
Back at the office, the data is downloaded and survey measurements are reduced. Each photo taken is given a coordinate accurate to +/-30mm.
The imagery, photo coordinates and camera calibration parameters are fed into Pix4d for processing. Pix4d generates keypoints for each image, then matches neighbouring images to each other with the end result being all images stitched together into one block.
The control points we marked on the beach are then found in the photos, and measured coordinates are compared to the calculated coordinates to verify accuracy. If we are happy with the accuracy, we proceed to generating a point cloud (up to 25million points per kilometre of beach), a 3D model, orthoplane and orthophoto imagery. Again, this process was repeated for each sector.
Below is a short video of how the processing works, using the main rockfall as an example.
To get the final result, as seen in the next video, all 9 projects were merged together and a 3D model was generated. The amount of data collected was huge and our PC spent 4 weeks continuously working to put it all together. The result though, was worth it.
Project stats:
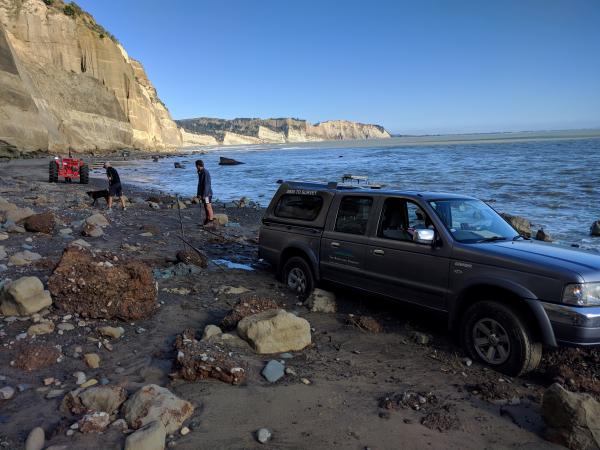
Properly bogged!
Excellent, efficient and friendly service all through, making our subdivision process very straightforward. We can thoroughly recommend The Surveying Company
HIGHLY RECOMMENDED! Had a great experience with Seamus, made my subdivision process very smooth and simple. Very professional service and very easy to deal with. Also helped me get an exemption from the $12K contribution payment to Hastings Council!I'm a very satisfied customer!
Nick was a great help and support throughout the subdivision process. Always quick to respond to calls and collaborated well to chase up subcontractors with me as required. Would thoroughly recommend Nick and the team at The Surveying Company to any future potential clients.
Excellent
Fast, efficient and reliable. Delivered what they proposed.
From start to finish, Nick was amazing to deal with, he talked a language that I could understand, he was very professional while being very user-friendly. I would strongly recommend him to anyone wanting to subdivide. I'd like to take the opportunity to thank him for all the help he gave throughout the process, thank you Nick, you made the process very easy for us.
Regards, John
Thank you The Surveying Company, this was my first time doing a subdivision and you made it super easy. Found you easy to contact and you always made prompt responses to my queries. I would recommend you guys to others. A very seamless process from my end. Raewyn
We are very happy with the service provided by all of the people we have dealt with at The Surveying Company, thank you.
Nick Wakefield did a great job through a difficult time with COVID and everything that went with it. There were many delays with the project outside of Nick's control. A project that should have taken months took years, but Nick continued to steer the project and followed up when he could.
The level of service and expertise we received during our land subdivision using Nick and The Surveying Company was outstanding. Nick was always prompt, responsive to our many queries and fully supportive for us throughout the whole process. I would recommend Nick and The Surveying Company to anyone seeking this type of expertise and advice.
The Survey Company H.B. recently completed a subdivision of our property.
The exercise was both a pleasant and positive experience with their approach always professional - relatable, open and obliging and
communications, timely and comprehensive.
Their service commitments are excellent.
From the outset Nick and staff were very approachable and professional. The process of subdividing was clearly explained and all costs laid out before starting so there were no surprises. We really appreciated Nick's patient answering of all our questions and extra advice when we also decided to add in easements for power. The surveying staff were friendly and respectful when on site and we would have no hesitation in recommending The Surveying Company to others. Many thanks to Nick and team.
We found Nick to be thoroughly professional and easy to deal with. We were under time pressure to complete the survey. Nick explained the process thoroughly before he started work, he kept us informed throughout, and completed the work within the expected time frame and on budget.